Methodology- GPR Report
Ground penetrating radar (GPR) is a widely used method that allows geophysicists to visualize structures in the subsurface. Using a transmitter and a receiver spaced a fixed distance apart, GPR emits an electromagnetic pulse and records the two-way travel time the wave takes to reflect off any interface it encounters. As the device is moved down the length of the transect, it records the reflections of the electromagnetic wave. Data was recorded every 10 cm down the entire length of the 54m transect. The acquired data is recorded as a wave reflection in units of time. The distance between the transmitter and reflection interface is:
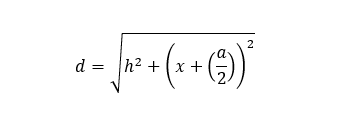
The two-way travel time of an electromagnetic ray in the subsurface is governed by this equation:

Where h is the depth the reflection interface, a is the distance between transmitter and receiver and v is the velocity of the ray. The two-way travel time of an electromagnetic ray is recorded in nanoseconds.
The other geophysical method utilized at the Greenway site was a dipole-dipole resistivity survey. Resistivity surveying is dependent on the electrical resistance of geologic material in the subsurface. Resistivity is not purely resistance; it is the measurement of resistance per unit volume.
Resistance is defined by Ohms law, volts divided by current:
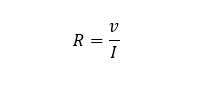
While the resistivity (p) of a cylinder is:

a and l are area and length of the cylinder. Therefore, the resistivity of the subsurface reflects unique transmission characteristic and is recorded in Ohm-meters. The resistivity array uses a line of electrodes down the length of a transect. Current is run through the ground and apparent resistivity is measured using combinations of four different electrodes.
Different types of geologic material have different resistivity values. For example, clays have a very low resistivity while ore bodies have high resistivity. Data values are not unique to specific materials in the subsurface. Gross classification can be deduced from site investigation in addition to resistivity values along the transect.
Finally, the Greenway site data from both GPR and resistivity is processed to yield the highest quality images possible. These images are then transposed on top of each other. The purpose of this overlay is to create a literate image that can be easily analyzed.
